Metrics in buckets
In this blog post, we consider storing and querying Prometheus metrics of ephemeral workloads in an object store such as S3. It serves as motivation for eph.
Ephemeral workloads
Consider 'jobs' such as integration tests and CI pipelines. These are often ran in containers, and it is natural to use something like cAdvisor to get metrics during their execution. This information can come in useful! Developers can see the CPU and memory usage of their tests, allowing them to pinpoint potential improvements. On the CI side, a pipeline author is likewise able to get detailed information of the resources used by the pipeline, and the pipeline user might realize they can make do with less RAM (or that they need more).
Great! We get the job metrics and push them to our existing metrics backend. This works, but can have cause some problems. If there is a lot of churn, these jobs will be generating a lot of data and series, putting a lot of pressure on the backend. This might require an increase in the provisioned resources and/or performance degradation. To combat this, we can consider some form of representative sampling, at the cost of losing exact, per-job data. This is not great.
There is also the question of retention. By using a shared / general purpose backend, we are subject to its retention period and compaction. We might want to keep job information for longer.
A dedicated backend?
An easy solution for all this is to have a dedicated metrics backend for these jobs. Configure whatever retention period you like, provision whatever resources you need, and it will never affect the 'main' backend.
This works, but now you need to maintain a whole new backend! And it might be the case that you want a very large retention period and a lot of churn, requiring a lot of resources.
Object storage
With a few assumptions, these jobs are candidates to being 'tossed into object storage'. The assumptions being:
- • Jobs are usually short-lived, lasting several hours at most;
- • There is no need for real-time alerting;
- • A developer will query the metrics of a single job at a time;
By 'tossed into object storage', we mean that the metrics are sent into a custom ingester. When the ingester receives a remote_write payload, it will append the received metrics to a file corresponding to the job, noting down the time it was received.
When a job hasn't sent metrics for a configured period of time, the ingester will mark the job as inactive, and the file will be uploaded to the object store.
For querying, we introduce a custom query engine. This query engine parses the PromQL query, extracting the job ID. It will fetch the corresponding file from the object store, ingest the metrics into a local TSDB, and execute the query.
This mechanism is much lighter than a full-fledged backend, at the cost of some latency at query time. To alleviate this, the querier can be provisioned with enough RAM to keep recent data in memory.
Caveats
Having a single file per job makes it easy to query individually, but it becomes hard to aggregate across jobs. This is a problem if you want to get the median CPU usage of all jobs, for example. It's possible to overcome this with some custom logic that periodically ingests the jobs and calculates aggregate metrics, but it feels like a big bandaing compared to how smooth it can be done in a 'traditional' backend.
Perhaps we can have the best of both worlds. Send highly sampled metrics to the 'main' backend, to get a birds-eye view of the aggregate job performance, but send everything to an object store.
Eph
Eph stands for 'ephemeral prometheus' and is a project I am working on to provide the functionality described in this blog post. It is still a POC and does not have most features, but it is available on GitHub.
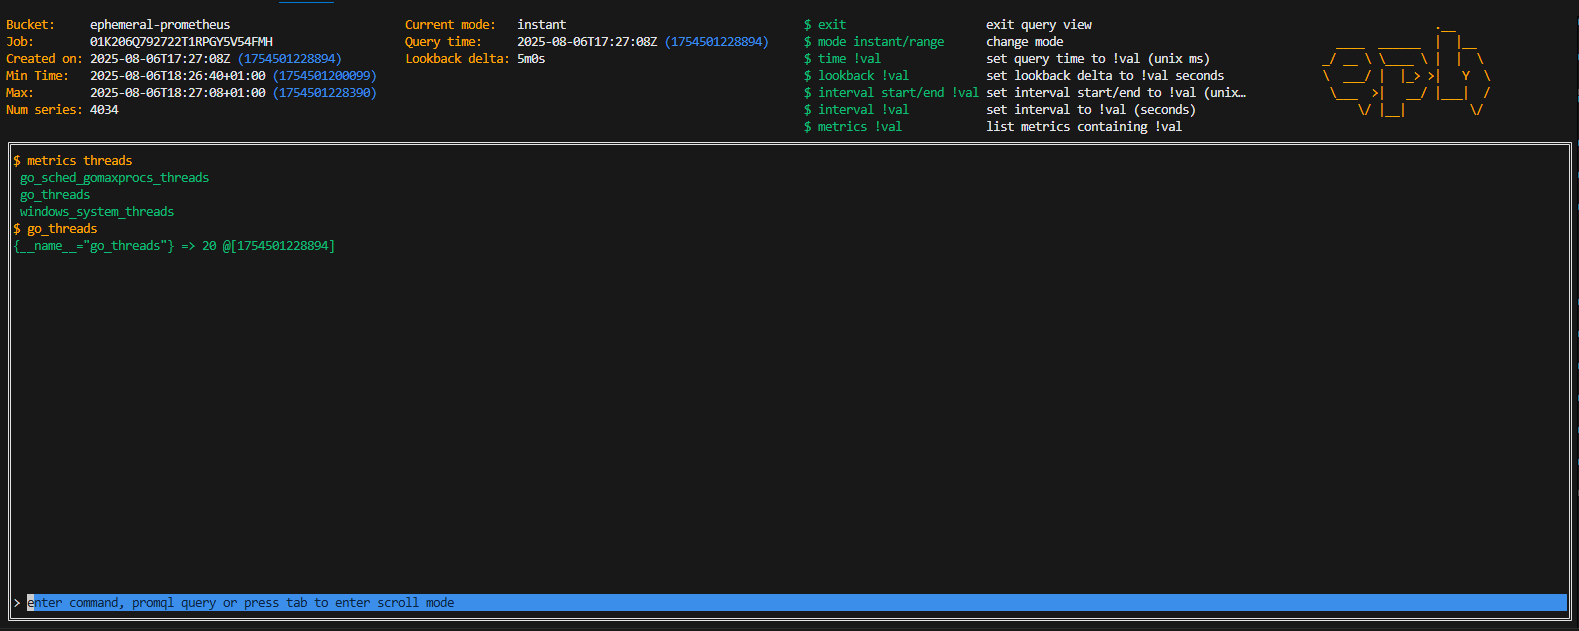
It comes with a nice CLI to run queries on metrics stored in Cloudflare R2 (S3 compatible store).
Comments
Loading comments...